MAP READING AND INTERPRETATION
NOTE: however student must understand how to read a map, then, use a map as a reference to answer possible questions.
NOTE; you must perform regular map exercises with a complex calculation and physical features, so as to be more skillful
NOTE: take a correct map and make discussion with your friends about the following issues
A. GRID REFERENCES IS THE LOCATION OF CERTAIN AREAS OR SPOT ON THE SQUARE GRID REFERENCES. IT IS USUALLY LIKE A CO-ORDINATES IN X-AXIS AND Y-AXIS. THE READING SHOULD BE (EASTING, NORTHING). THERE ARE TWO TYPES OF GRID REFERENCES
- FOUR FIGURES GRID REFERENCES (1234)
- SIX FIGURES GRID REFERENCES (123 456)
B. SCALE USUALLY STATED ON THE MAP ITSELF EITHER AT THE TOP OR BOTTOM OF THE TOPOGRAPHIC MAP. SCALE RANGES FROM 1: 50, 000 ( 2cm REPRESENTS 1 KM)
C. BEARING IS THE EXACT DIRECTION OF THE PARTICULAR AREA IN DEGREES.BEAR IN MIND ALWAYS MEASURE FROM AS THE STARTING POINT THEN TO IS THE PROJECTION. Example find the bearing of town A to town B
D. DIRECTION INDICATES IN WHICH OF THE CARDINAL POINTS I.E NORTH SOUTH EAST AND WEST US THE AREA.
E. CONTOUR LINES SHOW THE RELIEF OF THE AREAS SHOWING A HIGHLAND OF STEEP GRADIENT ( CONCAVE) OR THE GENTLE GRADIENT( CONVEX). THE INTERVAL GRADIENT SHOW THE DIFFERENT HEIGHTS OF THE CONTOUR LINE IN METRES.
F. RIVER FEATURES OF THE TOPOGRAPHIC MAP SHOW THE SHAPE OF THE RIVER AND THE PROFILE OF THE RIVER. E.G. MEANDER, MIDDLE COURSE/PROFILE.
G. RIVER PATTERNS ALSO SHOW THE DRAINAGE PATTERNS OF THE RIVER LIKE DENDRITICS, TRELLIS OR RADIAL PATTERNS.
H. HUMAN ACTIVITIES OF THE MAP ALSO CAN BE INDICATED IN THE MAP ITSELF IF YOU SEE ON THE MAP MORE RICE FARMING IT IS A FARMING ACTIVITIES DONE IN THE AREAS. EXAMPLES OF ACTIVITIES ARE LIKE MINING, FARMING, PLANTATION AND TOURISM
Grid reference
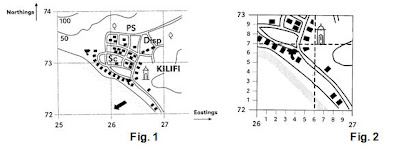
1. Always remember to read from the bottom left corner.
2. If the question ask for the four-figure grid reference or grid square of a particular building, e.g. the Hindu temple shown in Fig 1. Read the number for the easting first (from the X axis) and then the northings (from the Y axis). E.g example in Fig.1 is located in 2672
3. If the question ask for the six-figure grid reference or grid square of a particular building, e.g. the Hindu temple shown in Fig 2. Start by finding the grid square with the feature, then divide the grid square into 10 equal parts along both the northings and eastings. Place a ruler onto the bottom left corner of the feature, e.g. the Hindu temple is located at 266727. Read the number for the easting first (from the X axis) and then the northings (from the Y axis).
Direction
- Read the question carefully– if the question ask you the direction of Bfrom A, then draw a + sign at A and read the direction from A.
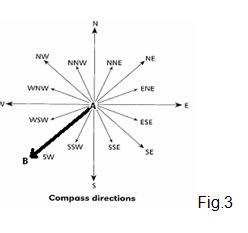 To measure the direction of one point to another, draw a straight line connecting them.
- Draw a straight line connecting the 2 points.
- Draw a + sign at where you are taking the bearing from.
- Place the protractor at the + sign with 0° facing north and then read the bearings from the point starting from 0° (north) clockwise as shown in Fig.4.
Height 
The height of a place above sea level can also be indicated by the contour lines.
Contours are imaginary lines connecting areas of the same height above sea level on a map.
The contour lines can be used to show the relief of a place such as whether the slope is gentle or steep. The spacing of the contours indicate the steepness of a slope – the closer the contours the steeper the slope and vice versa.
a) valley – associated with rivers, tend to be V-shaped and narrow in the upper course, broader in the lower course
b) plateau – elevated land with flat top and steep sides
c) escarpment – continuous line of steep slope at the edge of a ridge or plateau.Guide to describing reliefGive the average height ( or the range of height) of the relief of the area and state the height of the highest point.
Describe the relief of the area:
(a) state whether it is mountainous or hilly or whether it is part of a plateau. Point out and describe any relief feature that stands out in the area and state its location on the map.
(b) Describe the slopes in the area. States whether they are concave. Convex, uniform, steep or gently sloping.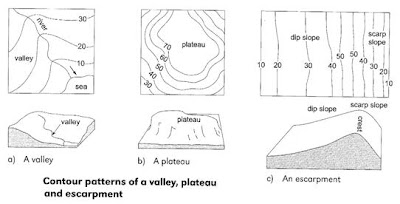
Example of how you can describe relief:
The height of the area ranges from below 10 metres near to the coast to 548 metres in grid square 8483.
The main relief feature is T Mountain which is in the western part of the area. As the mountain extends to the south-east, it becomes narrower and its height decreases. This part of the mountain has two peaks of heights about 240 metres in grid square 8582 and about 110 metres in grid square 8682. This part of the mountain also has two spurs from grid square 8583 to 8683 extending from south-west to north-east.
The contours of T Mountain are very close together in the area west of easting 85. This indicates that the slopes are steep. The spacing of the contours on the eastern side of the mountain is wider. The slopes here are therefore less steep.
Steps taken to measure gradient
Identify the two points which the measurement is taken from and the height above sea level for the two points. You can either refer to the spot heights, the bench marks or the contour lines.
Calculate the height difference (vertical distance) of the two points.
Convert the height to the same unit of measurement as for horizontal distance if necessary e.g. 3.048 feet = 1metre
Measure the distance of the 2 points on the map. Convert to actual distance by referring to the line scale or using the map scale ie. 1: 50,000 means 1 cm on the map represents 500m in actual distance.
Gradient is expressed in ratio form – vertical distance: horizontal distance ie. 1: 30 - which means for every 1 metre increase in vertical distance, there is an increase of 30 metres in horizontal distance.
River StudiesDescribing Rivera) drainage pattern ie – dendritic, trellis or radial
b) area drained – many tributaries joining the main river etc
c) direction of flow- the river flows from a higher ground to lower ground or towards the sea.
d) Course of river – ie. Straight or meandering, braiding, width
e) Presence of river features e.g rapids, waterfall
Drainage pattern
The drainage pattern of river is determined by the relief and the geological features of the land over which the river flows.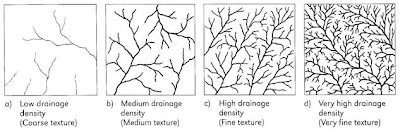
Drainage density
Refers to the number of streams on the land surface. The greater the number, the higher the density. Drainage density is highest in areas with impermeable rock of fine texture and heavy rainfall.
River valley
Wide valley floor as indicated by the widely spaced contour lines which increases in value away from both banks of the river.
V-shaped valley with steep slopes – indicated by closely packed contour lines which increases in value away from both banks of the river,
Flat valley floor as indicated by the absence of contour lines immediate to both banks of the river.
Evidence of water supply
Reservoir
Pump house
Pipeline

The height of a place above sea level can also be indicated by the contour lines.
Contours are imaginary lines connecting areas of the same height above sea level on a map.
The contour lines can be used to show the relief of a place such as whether the slope is gentle or steep. The spacing of the contours indicate the steepness of a slope – the closer the contours the steeper the slope and vice versa.
a) valley – associated with rivers, tend to be V-shaped and narrow in the upper course, broader in the lower course
b) plateau – elevated land with flat top and steep sides
c) escarpment – continuous line of steep slope at the edge of a ridge or plateau.Guide to describing reliefGive the average height ( or the range of height) of the relief of the area and state the height of the highest point.
Describe the relief of the area:
(a) state whether it is mountainous or hilly or whether it is part of a plateau. Point out and describe any relief feature that stands out in the area and state its location on the map.
(b) Describe the slopes in the area. States whether they are concave. Convex, uniform, steep or gently sloping.

Example of how you can describe relief:
The height of the area ranges from below 10 metres near to the coast to 548 metres in grid square 8483.
The main relief feature is T Mountain which is in the western part of the area. As the mountain extends to the south-east, it becomes narrower and its height decreases. This part of the mountain has two peaks of heights about 240 metres in grid square 8582 and about 110 metres in grid square 8682. This part of the mountain also has two spurs from grid square 8583 to 8683 extending from south-west to north-east.
The contours of T Mountain are very close together in the area west of easting 85. This indicates that the slopes are steep. The spacing of the contours on the eastern side of the mountain is wider. The slopes here are therefore less steep.
Steps taken to measure gradient
Identify the two points which the measurement is taken from and the height above sea level for the two points. You can either refer to the spot heights, the bench marks or the contour lines.
Calculate the height difference (vertical distance) of the two points.
Convert the height to the same unit of measurement as for horizontal distance if necessary e.g. 3.048 feet = 1metre
Measure the distance of the 2 points on the map. Convert to actual distance by referring to the line scale or using the map scale ie. 1: 50,000 means 1 cm on the map represents 500m in actual distance.
Gradient is expressed in ratio form – vertical distance: horizontal distance ie. 1: 30 - which means for every 1 metre increase in vertical distance, there is an increase of 30 metres in horizontal distance.
River StudiesDescribing Rivera) drainage pattern ie – dendritic, trellis or radial
b) area drained – many tributaries joining the main river etc
c) direction of flow- the river flows from a higher ground to lower ground or towards the sea.
d) Course of river – ie. Straight or meandering, braiding, width
e) Presence of river features e.g rapids, waterfall
Drainage pattern
The drainage pattern of river is determined by the relief and the geological features of the land over which the river flows.

Drainage density

Refers to the number of streams on the land surface. The greater the number, the higher the density. Drainage density is highest in areas with impermeable rock of fine texture and heavy rainfall.
River valley
Wide valley floor as indicated by the widely spaced contour lines which increases in value away from both banks of the river.
V-shaped valley with steep slopes – indicated by closely packed contour lines which increases in value away from both banks of the river,
Flat valley floor as indicated by the absence of contour lines immediate to both banks of the river.

Evidence of water supply
Reservoir
Pump house
Pipeline
a) Dispersed – houses far apart – areas with low economic development e.g. normadic herding, smallholdings
b) Linear – arranged in a line, usually along a mode of transport ( rail, road) or waterway (river, coast) to take advantage of the accessibility and resources.
c) Nucleated – concentration of buildings or houses – usually at road junctions or centers of economic activities ( e.g. community or village with facilities like school and shops)Choice of site for the location of airport, plantation, settlement etc.Availability of large area of flat land, ability to expand, very accessible e.g. near to rail or roads, availability of services or resources – remember to look closely at the map symbols on the map and refer to the legend of the map.
E.g. of question on Geography of food
Describe the type of food production in the map area and explain the importance of the roads to it.
The main food production is the growing of sugar-cane to be made into sugar as shown by the presence of large area under sugar plantation and the presence of sugar mill. The roads are important for the transportation of sugar-cane other settlements for refining or for sale. It also allows workers to be transported from their homes to the plantations and back.


Chapisha Maoni